
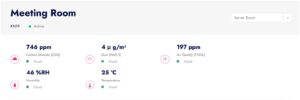
Air Panel View
Air panel is an overview for the quality of air that helps administrators to keep a look for air quality in the area.
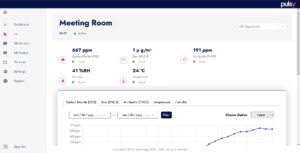
Graph View
- Inside graph will show the time on horizontal and level that are measure based on the type of parameter. (eg. CO2, PM2.8, C°, etc)
- To change the graph, click the tab on top of the graph based on what you want to see.
- You can also filter the date and time, or simply by choose the option whether to see the graph based on “Latest time“, “Day“, “Week” or “All the time“.
- You can download csv. file to save it as document for other uses.
Sensor Description
- The sensor can track 5 different parameter, which is carbon dioxide (CO2), Dust Particle(PM2.5), Air Quality (Total Volatile Organic Compounds), Humidity and Temperature.
| Sensor | Description |
|---|---|
| Carbon Dioxide (CO2) | CO2 is odorless gas, but at high concentrations it can be toxic to humans and animals, affecting breathing and heart rate. It can also be used to measure for airflow within a room to help adjust heating and air conditioning settings to be more energy efficient. |
| Dust (PM2.5) | PM2.5 refers to particulate matter with a diameter less than 2.5 micrometers (μm). Particulate matter can affect your health by causing respiratory problems and coughing, sneezing and other allergic reactions. |
| Air Quality (TVOC) | Ambient air quality is rated on a scale from good to bad by the sensor. A good rating means the air is safe to breathe whereas bad indicates an unhealthy level of air pollution. |
| Humidity | Humidity refers to the moisture in the air that can be felt as condensation on windows, walls or other surfaces. High levels of humidity can lead to mold growth as well as affect the comfortability of your home. Low humidity can cause dry skin, sore throats and lead to other health problems. |
| Temperature | A temperature sensor measures the temperature of a particular object or space. This type of sensor is used to measure air temperature or the temperature of the air in a building. |